Assessing educational innovation: learning the hard way

Leave a comment

Screen Shot 2014-12-19 at 7.17.31 AM

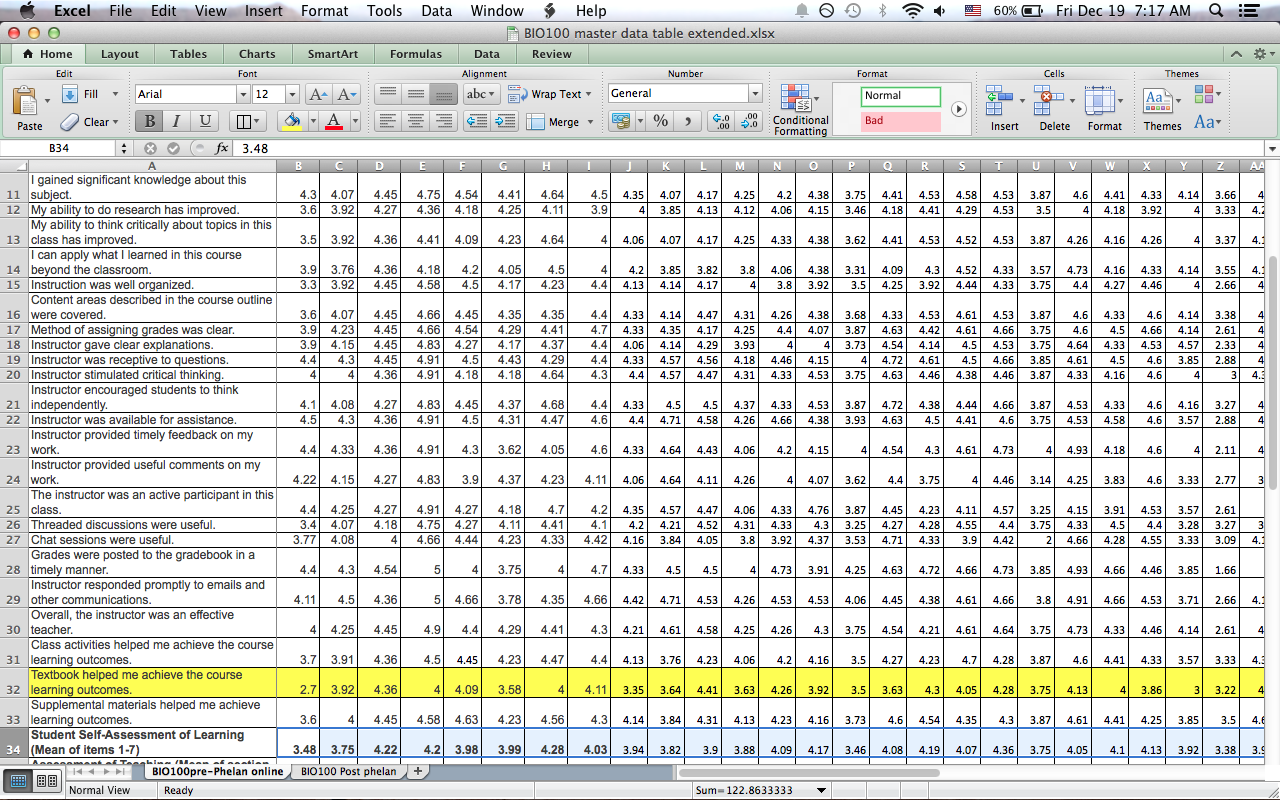
My master data table

One of the first tasks I was given when I started in my current position in July 2012 was to be the lead faculty for a non-majors introductory biology course. That course is one of the workhorses of the university as it is part of the GE curriculum, and it is basically the one and only science class most non-science majors will take. Run in several sections in multiple campuses and online, it was a formidable task to tackle. When I took over, the course had been in place with the same textbook for many years, and especially in the online version, plagiarism was rampant.

Over the next months I explored options for a new textbook, mainly looking for something fresh and attractive, with plenty of ready-made supplementary material, low(er) cost, and options to customize. I wanted something that was “ready-made” enough for a new adjunct to tackle, but flexible enough for an experienced instructor to make changes. An instructional designer helped me to develop a nice sequence of activities and assessments that would go hand in hand guiding the students. Weekly quick surveys were added to pick up any early student issues. I asked instructor feedback, and in August 2013 we switched. I expected to see a positive change right away.

Chuckle.

My university’s accelerated schedule means that we run the course monthly in multiple sections. So there was no real time off to test drive the system. The first months were full of glitches and student  frustration. Some instructors kept their old exams with the new textbook, resulting in vociferous protests for lack of matching between material read and material evaluated. Things calmed down over the next months and currently the course runs quite smoothly.

A few months ago I decided to use the large amount of data generated to compare before and after. I had student end-of-course survey and GPA data easily accessible, as well as a number of assessment data with the new course and tons of (anonymous) student comments.

What I learned:

  1. Student survey data don’t mean anything. This is not new of course, but it did hit me with full force going over the numbers of 40 something courses. Response rate was usually around 50% in the best case. The few cases that it was higher it was usually due to issues with the instructor.
  2. With the above I mean not only that there was no difference in student perception, but that the data were not really robust. If the same instructor who has been teaching the same class forever gets really different evaluations in back to back courses, chances are there are confounders. One can be different student population. Other may be just sampling bias (who answers the surveys?) A colleague with biostatistics experience is lending me a helping hand as we speak.
  3. The hardest lesson of course, was not keeping some of the previous assessment questions in place to compare. However, I do not really know it would have been feasible. The written assignments were so plagiarized that they could be found online. The exams were straight multiple choice questions. In any case, for a flipped classroom project I am participating now I had the precaution of designing a few strategic critical thinking questions placed in the “unflipped” class serving as control.
  4. Not all is lost of course. As I learn more about how to analyze education experiments, I have been given some ideas, such as rank the students and compare their grade in the biology class and then the grade in a subsequent lab class. Maybe the approach does not help high achieving students (who will do well no matter what), but there may be some difference in the low achieving group.

Of course even negative results are results, but it would be nice to see “something” improving. The only factor that moved significantly in the positive direction was the students’ opinion about the textbook. Will see how the next round if data crunching goes…

Dear readers, do you have any insight/advice about measuring learning effectiveness? Please share in the comments…any help is much appreciated.

Quick tutorial for Chi square in Excel.

Leave a comment

This is a tutorial for example 22.1, p.468 of Zar. Sorry, my cat is meowing in the background.
http://www.kaltura.com/index.php/kwidget/wid/_408291/uiconf_id/5428202/entry_id/1_ut5tqk58

Lies, darn lies, and statistics

Leave a comment

Ok so we have to do some statistics next week. Chi Square, how difficult can it be? I have seldom used Chi-square, as my work has been mainly with repeated data, before and after, t-test or the non-parametric, regressions and correlations, and the occasional ANOVA (for which one would usually ask a professional’s help). But Chi square is one of those simpler ones…contingency tables…like Mendelian tables. Puh.

So I open the Zar chapter, but the formulas and the numbers just make my head spin.

C’mon guys. This is 21st Century. We have software to do this! Let me show the students the Way!

Um, software.

There are tons of statistics software out there. I have personally used SPSS, Origin, and GraphPad Prism. I have also used Excel, although for more complex stuff I used macros developed by others. I liked GraphPad a lot, because it was so easy. And I know there are trial versions out there. We can do this!

Download the trial. Go to page 470 of the book. How easy can it be? Yellow and green flowers. Observed versus expected.

Data table in Prism

After that, I click Analyze and choose Chi-Square (or I can also click directly on the Chi sign).

Chi square analysis of example 22.1 of the Zar book in Prism.

Easy, right? It is not significant. The flowers have the same distribution. Nice.

Look back into the book. Darn. The Chi-square value is different. It says it is different from the expected distribution. Darn. I must have put the numbers wrong.

I will save you the next half an hour. I invert the columns. I read the book and it warns about computers doing it with only 1 degree of freedom, so I add Yates’ correction. Still, the value is different. A faint hope arises in me. I have seen errors in textbooks. Maybe…maybe. Whip up the calculator and follow the instructions.

This is not so difficult after all. I am just subtracting expected from observed, squaring the result, and then dividing by expected. Then I sum both. Yes, indeed it is 4.32. Look up the corresponding Chi value in the table. I don’t remember when was the last time I actually used a Chi-square table. Indeed, it is 3.84. Yep, it is lower. Yep, then the observed distribution is different (alternate hypothesis accepted).

Oh well. Let’s try Excel. At the end of the day, most people have access to Excel. Put in the numbers. It is not as easy as Prism, as I have to insert a function and choose among several that start with CHI but settle for CHISQ.TEST. However the data input is clearer, I have to choose between the actual and the expected range. Highlight, click Enter. A number comes up, 0.03766692. What the heck?

Another half an hour. I look up the Help section. They have an example, which I run dutifully. In the comments, it gives me the Chi square value and the probability. However, I only get the probability number:

CHISQ.TEST returns the probability that a value of the χ2 statistic at least as high as the value calculated by the above formula could have happened by chance under the assumption of independence. 

Long story short, I decide to run (completely humbled by now) Zar’s formula on the Excel example. As I crunch the numbers using the formula bar, I realize I can set up a nice template for the class to use, although I would still prefer they go through the number crunching themselves. I get the correct Chi value. Then I realize that whoever wrote the Help section was not very helpful: the probability given (which is less than 0.05) means that there is no “chance” in the calculated Chi square being higher = it is indeed independent. Why not writing it in a simple straightforward way?

Emboldened I run the green-yellow numbers in Excel using my little setup. Then, even cockier, I run example 22.3 without looking at the result. I am not doing it step by step anymore, I insert the complete calculation for one set and then just copy it for the rest. I get the correct result and I am content. Not only because it turned it ok but I have actually refreshed the knowledge, and it came back to me.

Excel analysis of examples 22.2/Zar, the Chi-square example in Excel, and the 22.3/Zar.

But what about Prism? I am sad. I decide to run the Excel example numbers, and the results come out ok. However, Zar’s 22.3 comes out wrong. I poke around in the internet and see reports of some bugs. That said, I have lost faith in it, at least for these calculations. If you know what is going on let me know!

What are the learning experiences from this episode?

  1. Thou shall be humble. I have a story about it but I save it for the next time.
  2. If you want to learn something well, learn from the bottom, ideally from scratch. This is a big deal, by the way. So much in science these days is done using kits and ready-made stuff that we forget or never learn the principle underneath. If everything goes well, it’s fine, but if it does not, how do you troubleshoot?
  3. Use more than one method when experimenting. Address different angles.
  4. Follow the scientific method- if there is a question, formulate a hypothesis and test it.
  5. Do blind tests to double check your results.
  6. Double-check, double-check, double-check.

I wrote this down to share with you a problem-solving experience, something we will be start doing next week. Being very critical of methods and thorough with data is absolute necessity of science. If you think this is something that only happens to beginners, check this Nature article out. Sloppiness, unfortunately, is becoming common, especially in the current very competitive Publish or perish culture.

Anyway, get ready to play with Excel next week! It should be fun 🙂

CUREing Ocean Plastics

STEM education exploring ocean plastic pollution

about flexible, distance and online learning (FDOL)

FDOL, an open course using COOL FISh

Main Admin Site for the WPVIP multisite

This multisite hosts public sites for Parse.ly and WordPress VIP

#Microjc

An Online Summer Book Club of Science

barralopolis

Teaching and learning reflections around science education

Disrupted Physician

The Physician Wellness Movement and Illegitimate Authority: The Need for Revolt and Reconstruction

The Blog of Author Tim Ferriss

Tim Ferriss's 4-Hour Workweek and Lifestyle Design Blog. Tim is an author of 5 #1 NYT/WSJ bestsellers, investor (FB, Uber, Twitter, 50+ more), and host of The Tim Ferriss Show podcast (400M+ downloads)

Here is Havana

A blog written by the gringa next door

Storyshucker

A blog full of humorous and poignant observations.

Jung's Biology Blog

Teaching biology; bioinformatics; PSMs; academia, openteaching, openlearning

blogruedadelavida

Reflexiones sobre asuntos variados, desde criminologia hasta artes ocultas.

Humanitarian Cafe

Think Outside the Box

Small Pond Science

Research, teaching, and mentorship in the sciences

Small Things Considered

Teaching and learning reflections around science education

1 Year and a 100 Books

No two people read the same book